
I’ve watched good SEO work get a client fired more than once. Not because the rankings were bad. Because the report made the work look invisible.
An SEO report is a structured summary of how a website performed in organic search over a set period. It covers things like rankings, traffic, conversions, links and technical health, and, more importantly, it explains what changed and what happens next.
Many SEO reports fail in one of two ways. They’re a wall of screenshots with no explanation, or they’re a list of tasks with no proof any of it mattered. Either version leaves the client wondering what they’re paying for, and a client who’s wondering usually stops paying.
A good SEO report makes decisions easier. It explains what has changed and what happens next. The client gets a clarity on what to double down on, what to fix, and what to stop doing.
This is how I put together SEO reports for clients: what I put in, what I leave out on purpose, and how I handle the months where nothing exciting has happened yet.
Key Takeaways
- A good SEO client report covers what happened, why it happened, and what comes next.
- Report early signals like GSC impressions to clients when clicks haven’t moved yet.
- Tie organic traffic to conversions, and turn technical findings into plain language.
- Skip the raw crawl exports, the vanity metrics, and the activity padding.
- Say out loud, in writing, how long results usually take. Google’s guidance puts it at four months to a year.
- Pick a small set of KPIs that match the client’s goals, and automate the data collection but never the explanation.
Why Most SEO Reports Fail to Do Their Job
A survey by Whatagraph found that 42.86% of clients in digital marketing are unsatisfied with their agency’s reports. Nearly half. For something that takes a few hours a month to get right.
I think the reason is simple. Most reports fail to do their job because they get built for the person making them. The agency exports whatever the tool spits out, attaches it to an email, and calls it done. The client opens it, sees forty charts, understands three of them, and forms an opinion based on whichever line happens to be pointing down.
A report is often the only time a client actually sees your work. That makes it part of the service, not an admin task you do after the service.
Part of the disconnect is that agencies and clients are quietly measuring different things. An SEO looks at a report and sees progress. A client looks at the same report and just wants a straight answer to one question: “is this working?”. Here’s roughly how that gap breaks down in practice.
| What the SEO is tracking | What the client actually wants to know |
|---|---|
| Domain rating or authority score | Are we getting more business out of this |
| Number of keywords being monitored | Is my traffic actually growing |
| Technical fixes completed | Does my site work properly now |
| Total backlinks in the profile | Is this worth what I’m paying every month |
| Content pieces published | Am I seeing real results, not just activity |
Why SEO Reports Are Important for Client Retention
SEO reports are important for client retention because they are the main way a client sees, understands and trusts the work they are paying for. Clients rarely leave because rankings dipped for one month. They leave because they couldn’t tell what was happening, why it was happening, or what the agency planned to do about it. A Forbes Agency Council roundup of complaints new clients have about past agency partners lists a lack of transparency and unclear reporting among them, and that pattern shows up whenever reporting is inconsistent or hard to follow.
A clear, regular report does several jobs at once:
- It builds trust by linking the work to traffic, leads and conversions instead of listing activity.
- It keeps clients patient through flat months, because the leading indicators and the work log show that progress is real even before results are.
- It moves calls from defending last month to planning next month.
- It creates natural openings for the next phase of work, because a report that exposes a content gap or a technical fix gives the client a reason to say yes.
- It cuts churn caused by silence and confusion, which is more common than churn caused by bad results.
Cadence matters as much as content. Reports that land on the same day each month, in the same structure, signal that the process is under control. Late or constantly reshuffled reports do the opposite, however good the SEO work behind them is.
Reporting is also a positioning tool. When a report is branded, well explained and clearly yours, it shows there is a real process behind the work, and satisfied clients are the ones who refer others (more on that in how to get SEO clients). For agencies that resell SEO under their own brand, the report is often the most visible part of the service, which is why white label SEO reporting matters so much.
SEO KPI Framework: How to Decide Which KPIs Matter
Knowing which KPIs exist is the easy part. The harder part is deciding which specific metrics earn a place for a particular client. This is the framework we use, and it works in the order below.
1. Start with the business goal, not the tool: Ask what the client is really paying for: qualified leads, online sales, local footfall, brand visibility, or authority in a new market. “More traffic” isn’t a goal until you know traffic for what.
2. Choose one outcome KPI that proves the goal: This is the number the client would quote to their own boss: organic leads, organic revenue, calls, or bookings. It leads the report.
3. Add two or three supporting metrics that explain movement in it: These are the search and behavior signals that sit upstream of the outcome, such as non-branded clicks, average position for money keywords, and conversion rate on the landing pages that matter.
4. Keep diagnostic metrics in reserve: Technical health, crawl and indexation data, link counts and Core Web Vitals explain constraints and risks. They go in the report when they are the story that month, and in an appendix otherwise.
5. Run every candidate through five filters: would it change a decision, can the client understand it without a glossary, can the work realistically influence it, can it be measured reliably, and can it be compared against a baseline or previous period? If a metric fails two or more, cut it.
6. Cap it and review it: Three or four headline KPIs is enough. Revisit them every quarter, or whenever the client’s goals change, so the report doesn’t keep tracking last year’s priorities.
| Client goal | Outcome KPI (leads the report) | Supporting metrics | Diagnostic (as needed) |
|---|---|---|---|
| Lead generation | Qualified organic leads (forms, calls) | Non-branded clicks, conversion rate on key landing pages, rankings for high-intent terms | Indexation, page speed, link growth |
| Ecommerce | Organic revenue and orders | Product and category page traffic, conversion rate by landing page, rankings for commercial terms | Crawl errors, structured data, Core Web Vitals |
| Local business | Calls, direction requests, bookings | Local rankings, Google Business Profile views, review volume | Citation consistency, mobile usability |
| Brand visibility | Non-branded impressions and share of visibility | Branded search growth, average position, AI visibility | Backlinks from relevant publications |
| New site or early-stage campaign | Leading indicators: impressions and indexed pages | Average position on target queries, pages close to page one | Technical fixes completed |
Three or four KPIs are usually enough. Beyond that, the numbers that matter start competing with the ones that don’t.
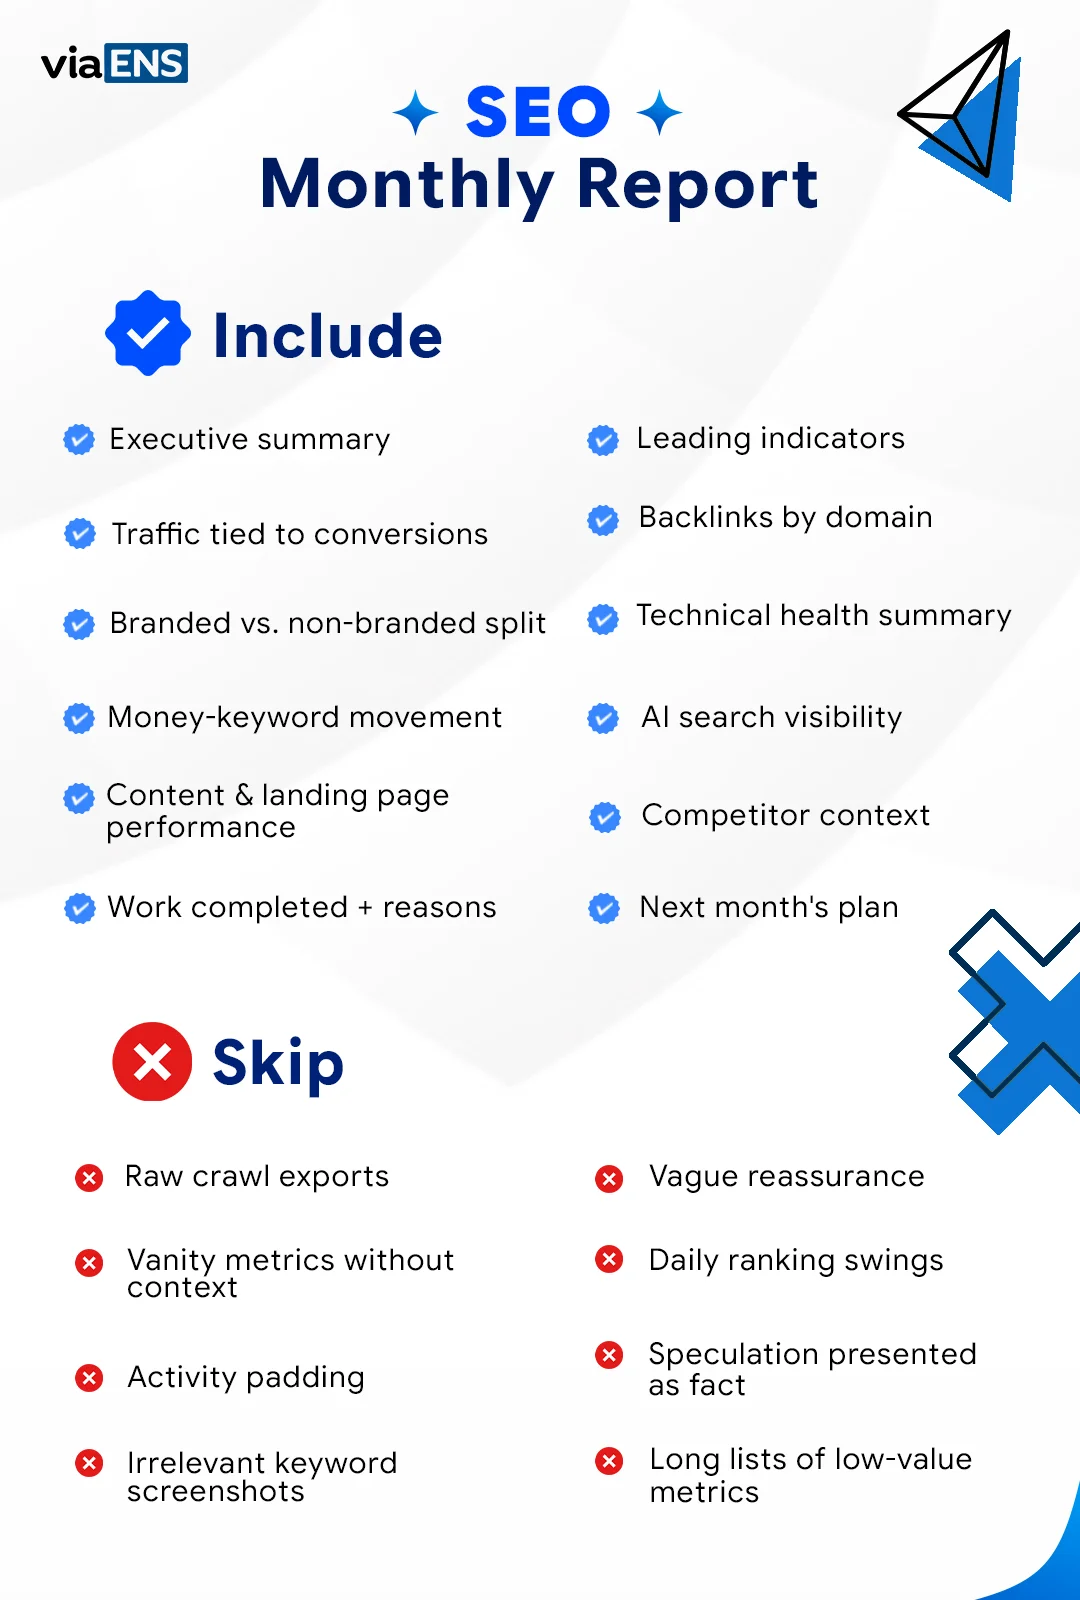
What to Include in an SEO Client Report
This is the list we use at our agency. Everything here earns its place by answering a question the client is already asking, even if they haven’t said it out loud.
1. Executive Summary
Most stakeholders never read past the first page, so the executive summary has to work on its own. We write it last and place it first. In three to five lines, it should cover the outcome against the agreed goal, the main reasons behind it (the pages, launches, losses or outside factors that explain the result), the work that went live, any risk or decision that needs the client’s input, and the single most valuable action for next month.
“Traffic went up” isn’t a summary. “Organic leads rose 12% month over month, driven by two service pages that reached page one, and next month we’re extending that approach to three related pages” is.
2. Leading Indicators First (Impressions, Indexation, Average Position)
Rankings and clicks lag behind the work, sometimes by months. Google Search Console impressions usually start moving first, and in my experience that’s the earliest honest sign that Google is reacting to what you’ve published.
So we open with impressions alongside clicks, indexation status for new or updated pages, and average position for the target keywords. A move from position 18 to 14 doesn’t look like much in isolation. Sitting next to a flat click count, it tells the client the work is landing even though the payoff hasn’t arrived.
One caution: These are diagnostic, not proof. They tell you something is moving, not that the result is guaranteed, and I frame them exactly that way in the report.
3. Organic Traffic and Conversions
Organic traffic tells you people are showing up. Conversions tell you whether it mattered. If the client tracks phone calls, form fills, or purchases from organic search, those go in the report right next to the traffic numbers.
For most clients, revenue or leads from organic is the number that decides whether they renew. If your tracking can’t connect SEO to a business outcome yet, fix that before you polish anything else in the report. It’s the same logic behind a good SEO budget ROI conversation: you can’t defend a spend you can’t tie to results.
I also show trends instead of raw numbers. “Up 8% month over month” lands better than “1,200 clicks” because the client doesn’t have to know whether 1,200 is good.
Look at organic traffic from more than one angle. A monthly trend line is the baseline, but the top landing pages, the split by country or device, and engagement signals such as engagement rate and time on page show whether the visitors are the right ones. Flat traffic can hide real progress, like more conversions, higher-quality visitors, or stronger performance on commercial pages, which is exactly why traffic should never be reported in isolation. Where seasonality matters, add a year-over-year comparison so a quiet month isn’t mistaken for a decline.
Define what a conversion means for each client at the start (form fills, calls, purchases, sign-ups) and report against that definition every month. In GA4, filtering the landing-page report to organic search shows which pages bring visitors who convert and which bring traffic that doesn’t, and that feeds directly into next month’s plan.
If the client has no conversion tracking yet, don’t skip the section. Use proxy signals instead: organic traffic to the pages closest to revenue, visits to pricing or contact pages, rankings for the highest-intent keywords, and assisted conversions where they exist. Then make fixing the tracking part of the plan.
4. Branded vs. Non-Branded Traffic
Branded traffic comes from people who already searched for the client’s company or product name. Non-branded traffic comes from people who found the site through generic category or problem searches. The two tell very different stories. Growing non-branded traffic means the SEO work is reaching new audiences. Flat non-branded traffic next to rising branded traffic usually means brand awareness is doing the heavy lifting, not search discovery.
Google Search Console now has a built-in branded queries filter in the Performance report, so the split takes a couple of clicks instead of manual keyword sorting. Add a one-line interpretation next to it, because most clients have never seen this breakdown.
5. Keyword Ranking Movement
Not a list of five hundred keywords. The ones that matter, the ones tied to revenue, plus anything that jumped onto page one or dropped off it.
If a page moved from page two to the bottom of page one, I call that out by name. Page two keywords that are creeping up are some of the best early wins to show a client, since they haven’t produced clicks yet but they’re close.
Treat rankings as a trend. Positions bounce around from day to day, and a report pulled on an unusually good or bad day can suggest a win or a decline that isn’t real. Average position over the period, grouped by the landing page or topic you worked on, gives a steadier picture and makes more sense read alongside clicks. Google’s own average position figure varies by query, device, country and result type, so report it by meaningful segment rather than as one sitewide number.
Keep the keyword set relevant to the period, too. If the month’s work was the blog, report the blog keywords. Adding a market the client isn’t targeting, or hundreds of unrelated terms, invites questions about numbers that have nothing to do with the work.
6. Backlinks Earned, Not Just a Count
“We built 12 links” means nothing. “We earned a link from a respected industry publication that sends real referral traffic” means something. I list the actual domains, not just a total, and I say why each one matters. This section is also where clients notice quickly if the agency has been cutting corners, which is one reason I never blur it.
Include links lost as well as links gained, since a sudden drop in referring domains is worth investigating early. If no link building happened that month, say so plainly instead of padding the section. For more on why link quality beats volume, see our breakdown of link building ROI.
7. Content and Landing Page Performance
If the engagement includes content, report on it as its own line. Clients generally want three answers: which piece performed best this month, how much organic traffic it brought in, and where the next opportunity is. Flag pages that gained rankings or conversions after an update, and pages that stalled and probably need better keyword targeting, stronger internal links or a refresh. Landing-page data also shows where organic visitors actually arrive and whether that matches where the client wants them to arrive.
8. Work Completed That Period
What got published, what got updated, what keyword research shaped next month’s content, what technical fixes went live. A short bullet list up top so it’s skimmable, then a line or two under each item explaining why we did it and what it should contribute over time.
This is the section that keeps clients patient during slow months. It shows the machine is running even when the output hasn’t built up yet.
Where an item comes from the original proposal or audit, say so. It lets the client see the plan being delivered phase by phase instead of a random list of tasks.
9. Technical Health, Summarized (Not Dumped)
Run a crawl, sure. Then pull out only what the client would actually care about. Broken links found and fixed, pages missing metadata, indexation problems, Core Web Vitals flags, redirect chains cleaned up. I have observed that five or six clear lines beat a forty-tab spreadsheet every time.
The crawl itself is only the raw material. The report should carry what the issue was, what it affected, and whether it’s fixed. If a fix went live this period, say what changed and how it moved site health. For anything still open, explain the business impact and give a priority order. A single site health score, tracked as a trend, is an easy way to show progress without asking the client to understand crawl budgets, as long as you say which tool produced it.
10. AI Search / AEO Visibility
AI search is the fastest-moving topic in SEO right now, and almost every business wants to show up in the answers people get from ChatGPT, Perplexity, Gemini and search engines’ AI overview features. Clients have noticed, so this section increasingly answers a question they are already asking.
Clients are starting to ask whether you can put their brand in AI engines or not. I check whether the client’s brand or content shows up when I prompt ChatGPT or Perplexity with their money queries, and I note what I find. It doesn’t need to be elaborate. A few lines showing you’re watching it is enough to stop a client from wondering whether they need a different provider.
Two built-in sources now make it easier to back this with data. Google Search Console has a dedicated generative AI performance report, launched in June 2026, that shows how often your pages appear in AI Overviews and AI Mode, although it currently reports impressions only, with no clicks. And since May 2026, GA4 groups visits from recognized AI assistants such as ChatGPT, Gemini and Claude into an AI Assistant channel. The channel isn’t retroactive, and clicks from Google’s own AI Overviews still count as organic search; these are the two caveats worth passing on.
Keep the framing honest. AI traffic is still small next to organic search for most sites, so present it as an emerging channel and an early signal of brand visibility, not a replacement for the numbers above. Some rank-tracking platforms also track AI mentions and citations across assistants if you want a fuller view. For a client who only cares about Google today, a short paragraph is enough. For a client already losing clicks to AI answers, move the section higher in the report.
11. Competitor Context
Numbers land better next to a benchmark. A short competitor snapshot covering who the client is really competing against in the results, how their rankings and visibility compare, and where competitors are gaining shows the client the landscape they are in and gives you a natural place to point at gaps. It also explains cases where a page struggles despite good content: a competitor’s link profile is simply stronger.
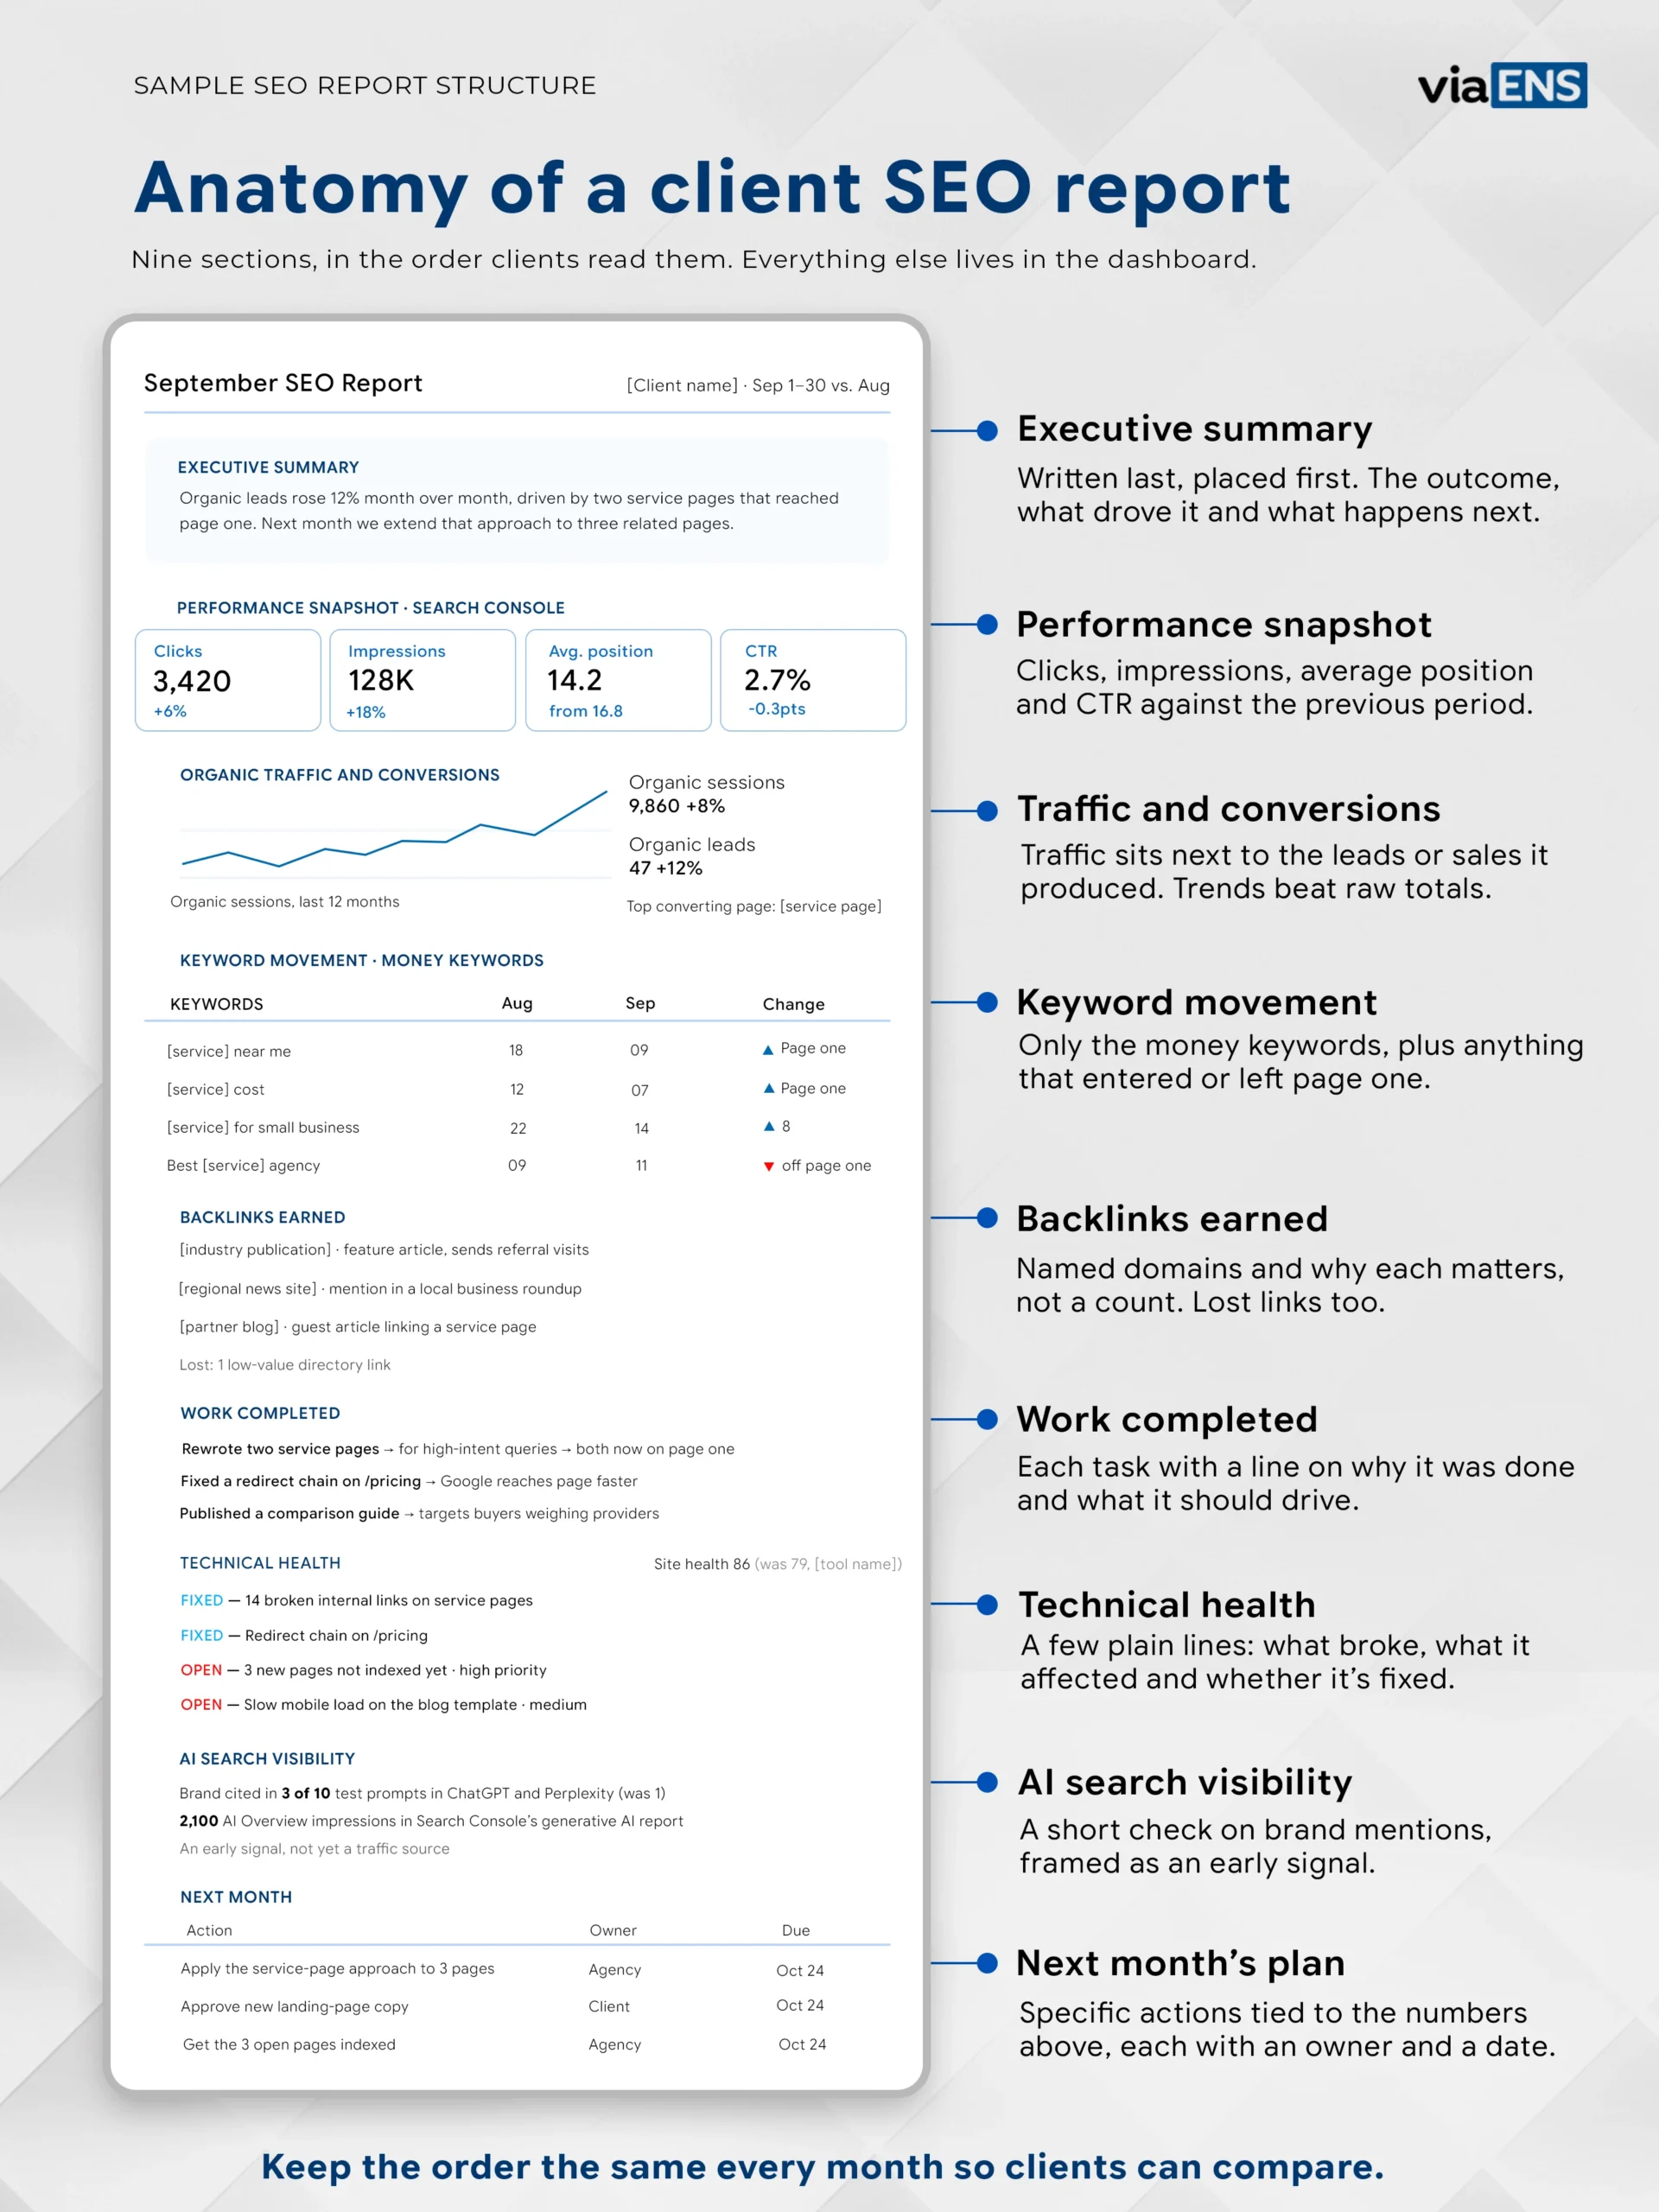
What’s Next
Every report ends with next month’s plan. Bullet points, specific, short. It shows the work is planned instead of reactive, and it gives the client something to respond to on the next call.
Tie each recommendation to a number already shown in the report, and name an owner and a rough date so nothing depends on memory. This is also the place to list anything you need from the client, such as approval on a new landing page or access to a system, since those roadblocks delay results more often than the SEO itself. Good sources of next-step ideas are pages sitting just below page one, pages with strong traffic but weak conversions, and content gaps the data has exposed.
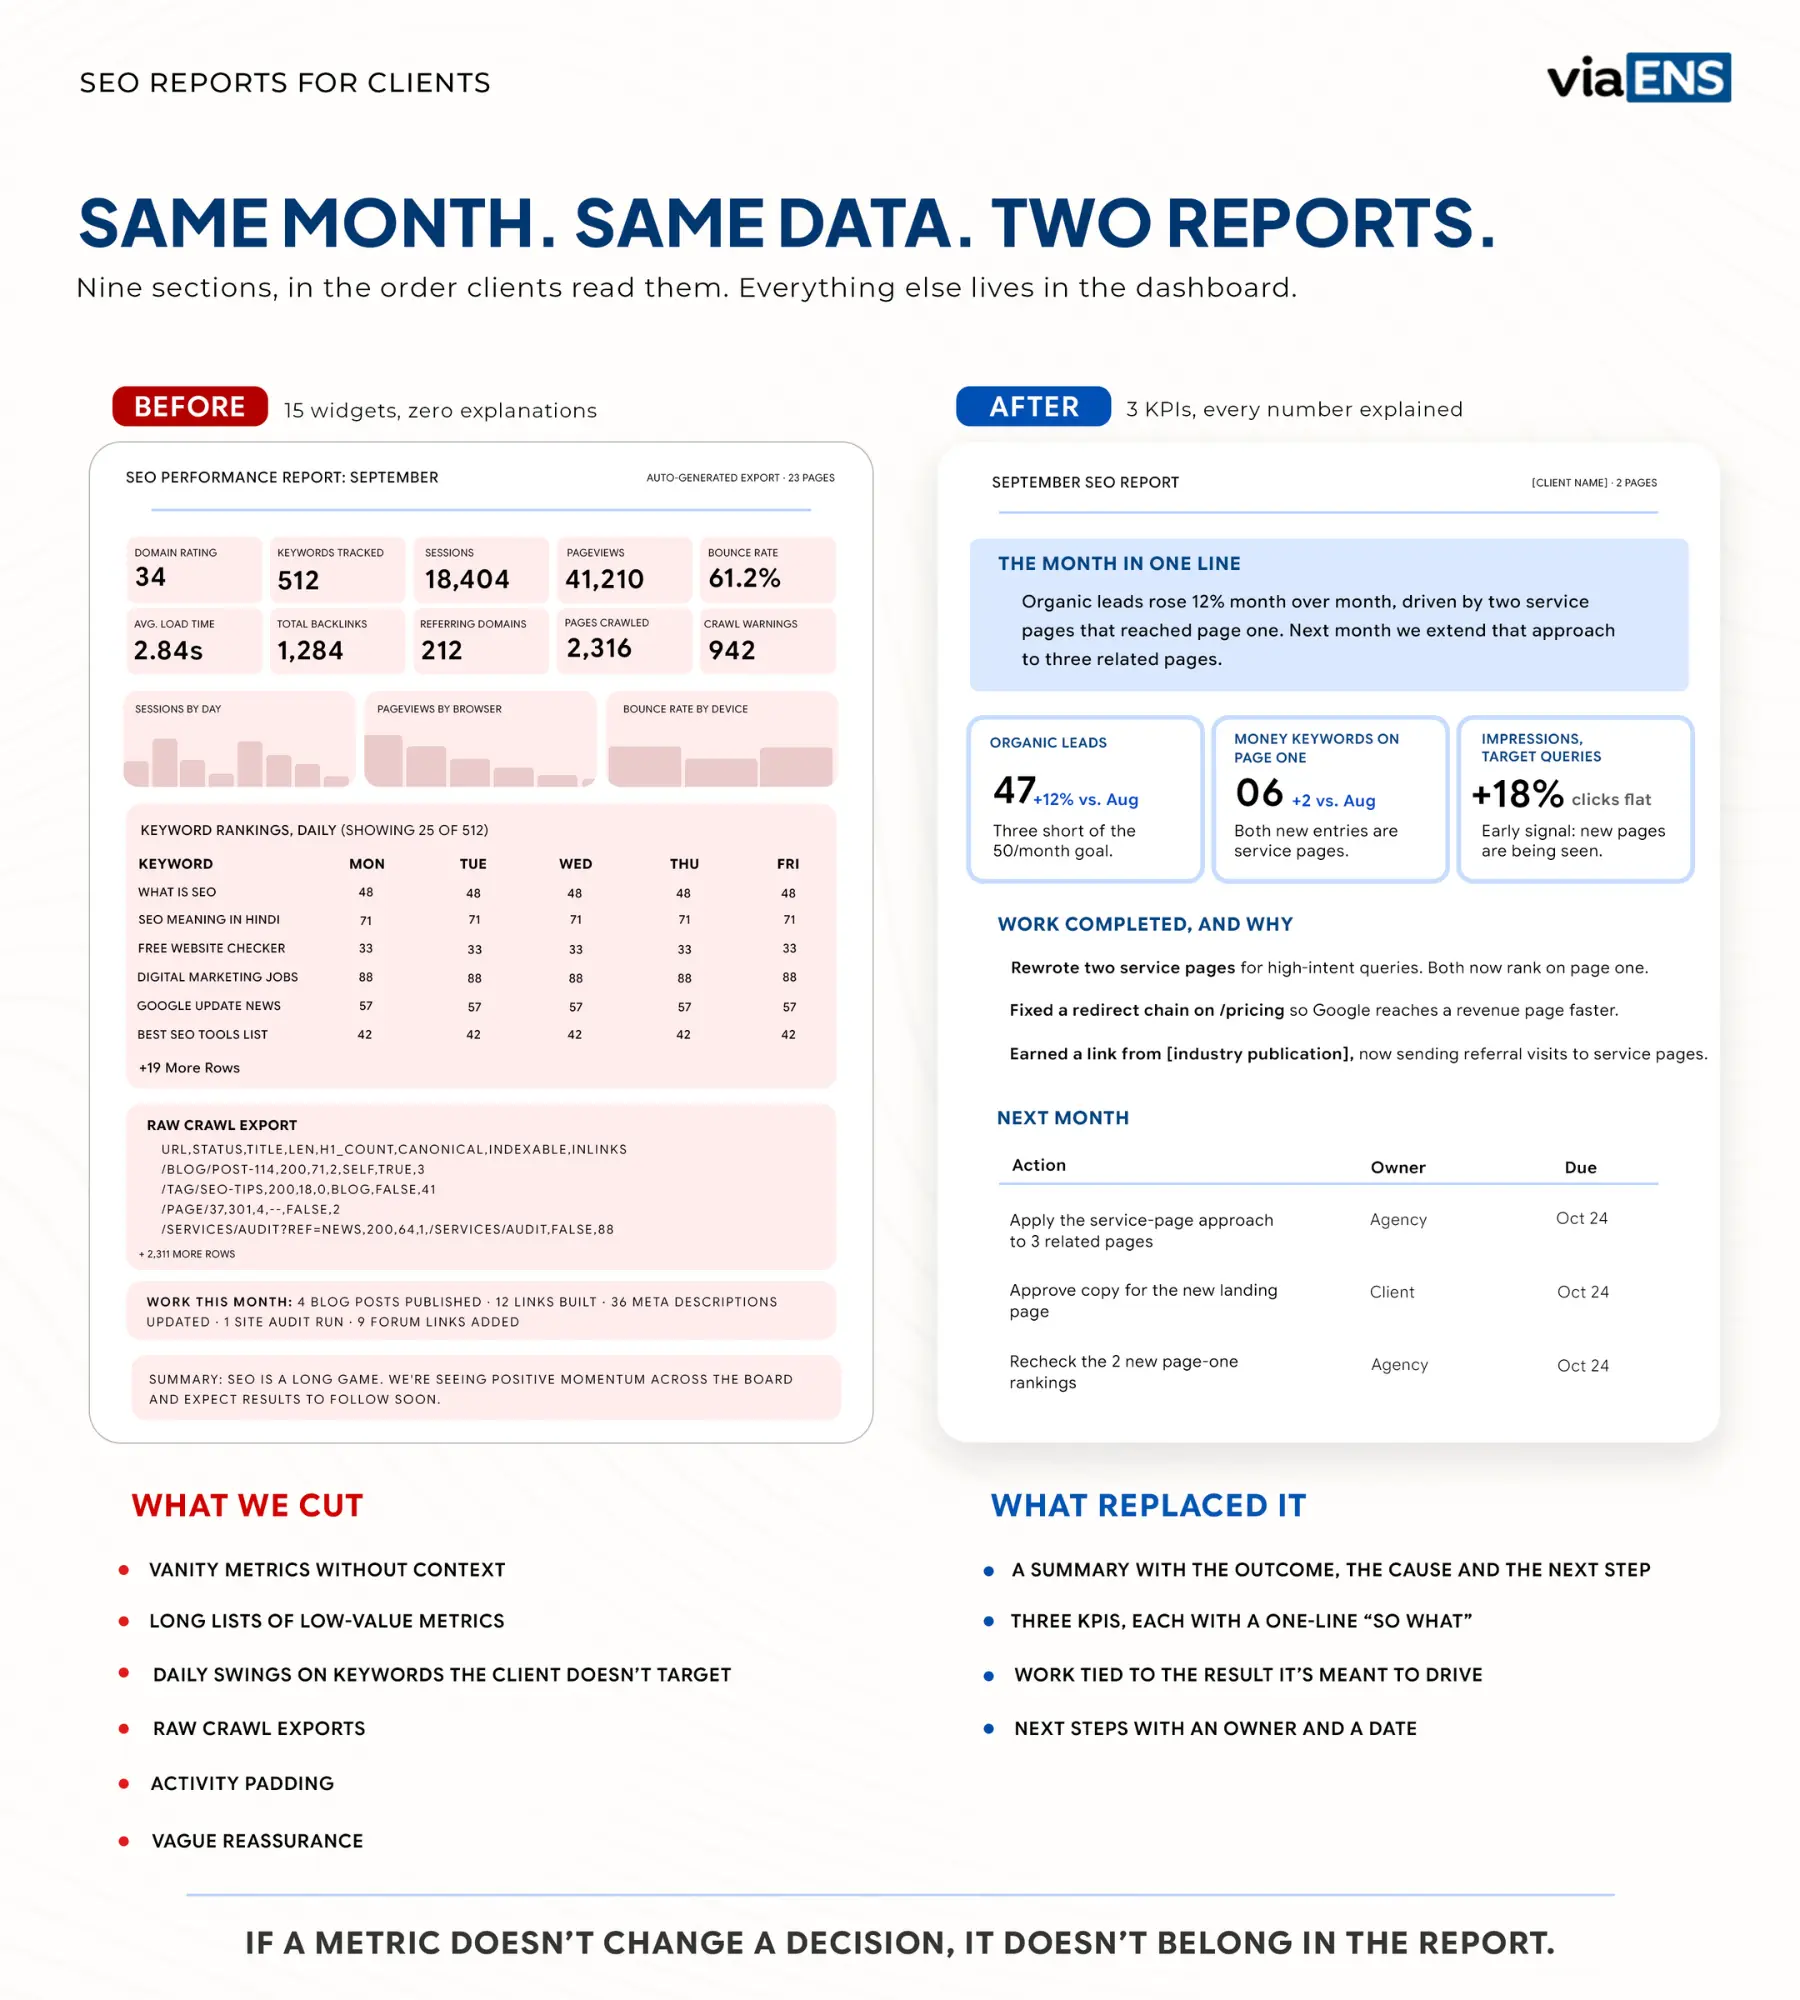
What to Skip in an SEO Client Report
Knowing what to cut matters as much as knowing what to add. Here’s what we leave out on purpose.
- Raw crawl exports: Nobody outside the SEO team can read them, and handing one over signals that you didn’t do the interpreting.
- Vanity metrics with no context: Domain authority scores, total keyword counts, and raw session numbers all look impressive and mean very little on their own.
- Activity padding: “Published four posts” sounds productive. If clicks are flat, it means nothing to the client, and they know it. I’ll report the work, but I never let the work stand in for results. If the gap between activity and outcome is real, I say so plainly.
- Ranking screenshots for keywords the client doesn’t care about: Every extra chart dilutes the ones that matter.
- Vague reassurance: “SEO is a long game” is true, but it isn’t a report. If you’re going to ask for patience, back it up with the leading indicators showing why it’s warranted.
- Daily ranking fluctuations: Positions move for reasons that have nothing to do with your work. Reporting them creates anxiety and hides the trend, so stick to monthly or quarterly movement.
- Speculation without data: A theory presented as fact costs you credibility the moment it turns out wrong. Label inferences as inferences, and keep correlation separate from confirmed cause.
- Long list of low value metrics: Individual page load times or article-level bounce rates rarely change a decision. If a metric doesn’t influence one, it belongs in an appendix at most.
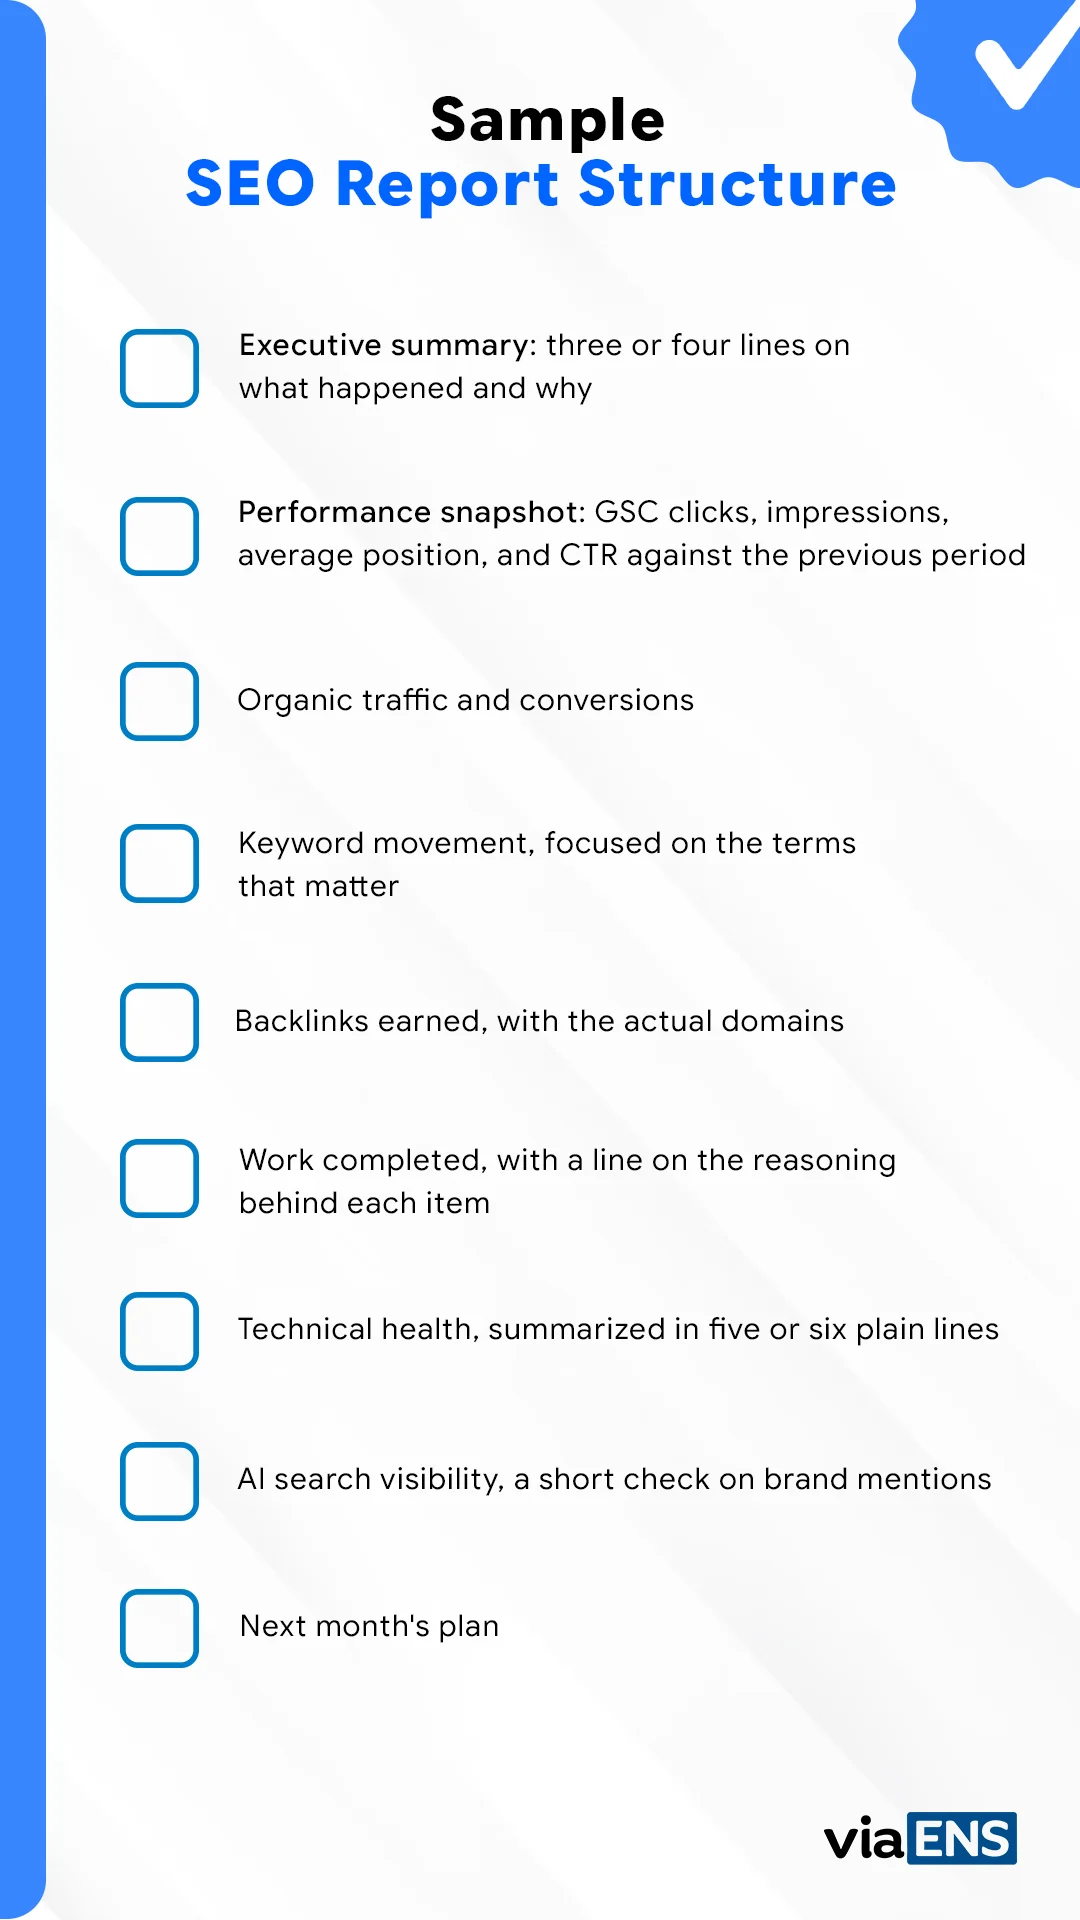
Sample SEO Report Structure
If you’re looking for an SEO report template to start from, this is the order I’d use.
- Executive summary: three or four lines on what happened and why
- Performance snapshot: GSC clicks, impressions, average position, and CTR against the previous period
- Organic traffic and conversions
- Keyword movement, focused on the terms that matter
- Backlinks earned, with the actual domains
- Work completed, with a line on the reasoning behind each item
- Technical health, summarized in five or six plain lines
- AI search visibility, a short check on brand mentions
- Next month’s plan
Add a quarterly roadmap every three months. And put your client’s branding and their actual goals in it, because a report that feels generic gets treated like one.
Ready-Made SEO Report Templates
You don’t have to build from a blank page. Starting from a template removes the structural decisions so the time goes into commentary. Good starting points:
- Looker Studio templates: Search Console and GA4 templates from providers such as Data Bloo give you a free or low-cost, fully customizable base.
- Reporting-tool templates: DashThis, Whatagraph, SE Ranking and others ship pre-built SEO report templates that fill in once you connect the client’s accounts. SE Ranking’s include Monthly Traffic and Rankings, Website Audit and Competitor Overview.
- Worksheet-style templates: for the thinking rather than the charts, a simple worksheet that records the question, the filters and date range, the baseline, the finding and the next action keeps every report repeatable.
- Your own master template: after a few months most agencies settle on two or three standard formats, such as a one-page visual summary for busy owners and a detailed version for marketing teams, and match each client to the one they actually read.
Whatever you start from, keep three rules. Keep the layout and metric order consistent so clients can compare month to month. Personalize it with the client’s goals and branding. And write fresh commentary every time, because a template with the same words in it is a report nobody reads.
Adjusting the Report for Different Readers
The structure of the report can stay the same from client to client. The depth, the language and the emphasis shouldn’t. Before each build, ask who is reading, what they control, and what they are worried about, and let those answers decide what goes on the first page.
| Reader | What they care about | How to shape the report |
|---|---|---|
| Small business owner or non-technical client | Proof that SEO is producing enquiries, calls or sales | Lead with leads and revenue in plain English, define any term you use, annotate charts with the “so what,” and keep technical detail for an appendix |
| Marketing lead | Which pages and campaigns perform, and how priority topics are moving | Add landing-page and keyword-group breakdowns and campaign-level results |
| Executive or decision-maker | Outcomes and whether the budget is justified | Summary first, simplified KPIs, trends and revenue impact, no jargon |
| Enterprise stakeholders | Several teams, large sites, multiple markets | Layer the report: a one-page executive view on top, then sections for each team (content, development, product), segmented by market or template, with an owner for every action |
| Investors or board | Growth, efficiency, and how much of the pipeline is supplied organically | Fewer, higher-level numbers: organic share of leads or revenue, year-over-year growth, and return against spend, reported quarterly or annually with assumptions stated |
| Internal SEO or marketing team | Diagnosing issues and planning the roadmap | Full detail: query and page segments, technical findings, competitor and backlink gaps |
Business model changes the metrics too. E-commerce clients care about organic revenue and product and category page performance. Local businesses care about Google Business Profile views, calls, direction requests and review volume alongside rankings. B2B clients care about lead quality, so validate with sales where you can. For enterprise accounts where link acquisition is a major workstream, the backlink section usually needs its own layer; our guide to enterprise link building covers how those programs are structured.
How to Report When There’s Nothing Big to Show Yet
This is the hardest part of client SEO reporting, and honestly, the reason most people search for how to do it in the first place. The work’s been done. The results haven’t shown up. The client’s next email is going to be about that.
Here’s what we do.
First, we set the timeline in writing before the first report goes out. Something like “new content typically takes three to six months to achieve a stable ranking position on Google, and here’s what we’ll track in the meantime.” That single paragraph has saved me from a lot of awkward monthly calls. Google’s own guidance points to four months to a year for SEO benefits to show up, so I’m not inventing a comfortable number; I’m stating the actual range.
Second, we report the leading indicators in the same place we’d normally put results. Impressions growing on target queries means the content is starting to get seen, even if it hasn’t turned into clicks. We have had clients watch impressions climb for a full month before traffic followed, and those early numbers were the reason they stayed patient.
Third, we don’t oversell. Calling a tiny bump a breakthrough backfires the moment the next month is flat. “Early signs of growth” is honest and holds up. And if a month is genuinely bad, we say that too, along with what we think caused it and what we’re doing about it. Clients respect that far more than a report that pretends everything’s fine.
Clients who understand that timeline are also the ones who see why ongoing work usually beats a one-off push, which we cover in monthly SEO vs. one-time SEO.
How to Report SEO Declines
A decline is the moment the report matters most, and the moment many agencies send the least. Clients usually notice a drop before the report reaches them, so the worst position to be in is having to explain it after they’ve already raised it. Handle it like this:
- Tell them first: Put the drop in the executive summary, in plain words, with the size of the change and the period it covers. Don’t make them find it on page six.
- Locate it before you explain it: Establish where the loss sits: which pages, queries, devices or countries, and whether impressions, click-through rate or position changed. “Clicks fell 12%” is an observation. A loss concentrated in three informational pages with stable impressions and lower CTR is a diagnosis.
- Check the usual causes in order: Rule out measurement problems first (tracking changes, the wrong property, incomplete dates), then seasonality, then search-side causes such as algorithm updates, changed result layouts and AI answers, then technical issues, then competitor movement.
- Separate what is confirmed from what is suspected: Write it as observation, evidence, likely cause and limitation, and be direct where you can’t be certain. A guess presented as fact costs more credibility than an honest “most likely, but not proven.”
- Put it in context: Show the trend over a longer window and, where relevant, year over year, so a normal dip isn’t read as a collapse. If your own change caused it, say so.
- Finish with the response: Name the action, the owner, the date you’ll recheck, and what result would tell you it worked.
How Often to Send SEO Reports: Weekly, Monthly, Quarterly and Annual
A monthly SEO report shows the work and the near-term movement. It’s detailed, it’s specific to that period, and it’s mostly about proving the engine is running.
A quarterly review does something different. It steps back from the month-to-month noise and shows direction. What’s working, what we’re changing, what the next three months look like. If your client is the type to panic over a single dip, a quarterly view is where you show them the dip in context.
I keep both, for most clients. The monthly SEO report keeps them informed. The quarterly one keeps them patient.
| Cadence | What it covers | Best for | Typical format |
|---|---|---|---|
| Weekly | A short snapshot of a few KPIs, plus any effects from a launch, migration or incident | Site launches, migrations, major fixes, or clients who report upward on a short cycle | One-page summary or live dashboard |
| Monthly | The full report: executive summary, KPIs with commentary, work completed, ranking and traffic movement, next steps | The standard for retainers; keeps the client informed and accountable | PDF with commentary, plus a dashboard link |
| Quarterly | Direction and strategy: what’s working, what’s changing, the next three months, roadmap and budget | Clients who panic over a single dip, or who make budget decisions each quarter | Review deck or call, with a roadmap |
| Annual | Year-over-year growth, seasonality, long-term traffic and link trends | Budget planning, renewals, board or investor updates | Summary report or presentation |
Whatever cadence you choose, label the comparison window (previous period or previous year) and stay consistent. A 28-day window smooths out weekday imbalance, while calendar months are easier for finance teams to reconcile. If the comparison isn’t perfectly like-for-like, say so.
PDF, Live Dashboard, or Both
From my experience, PDFs are better for storytelling or a generic email. You can lead with an executive summary, add commentary to every chart, and control exactly what the client reads first. Live dashboards, built in something like Looker Studio, are better for transparency, since clients can check in anytime without waiting for your email.
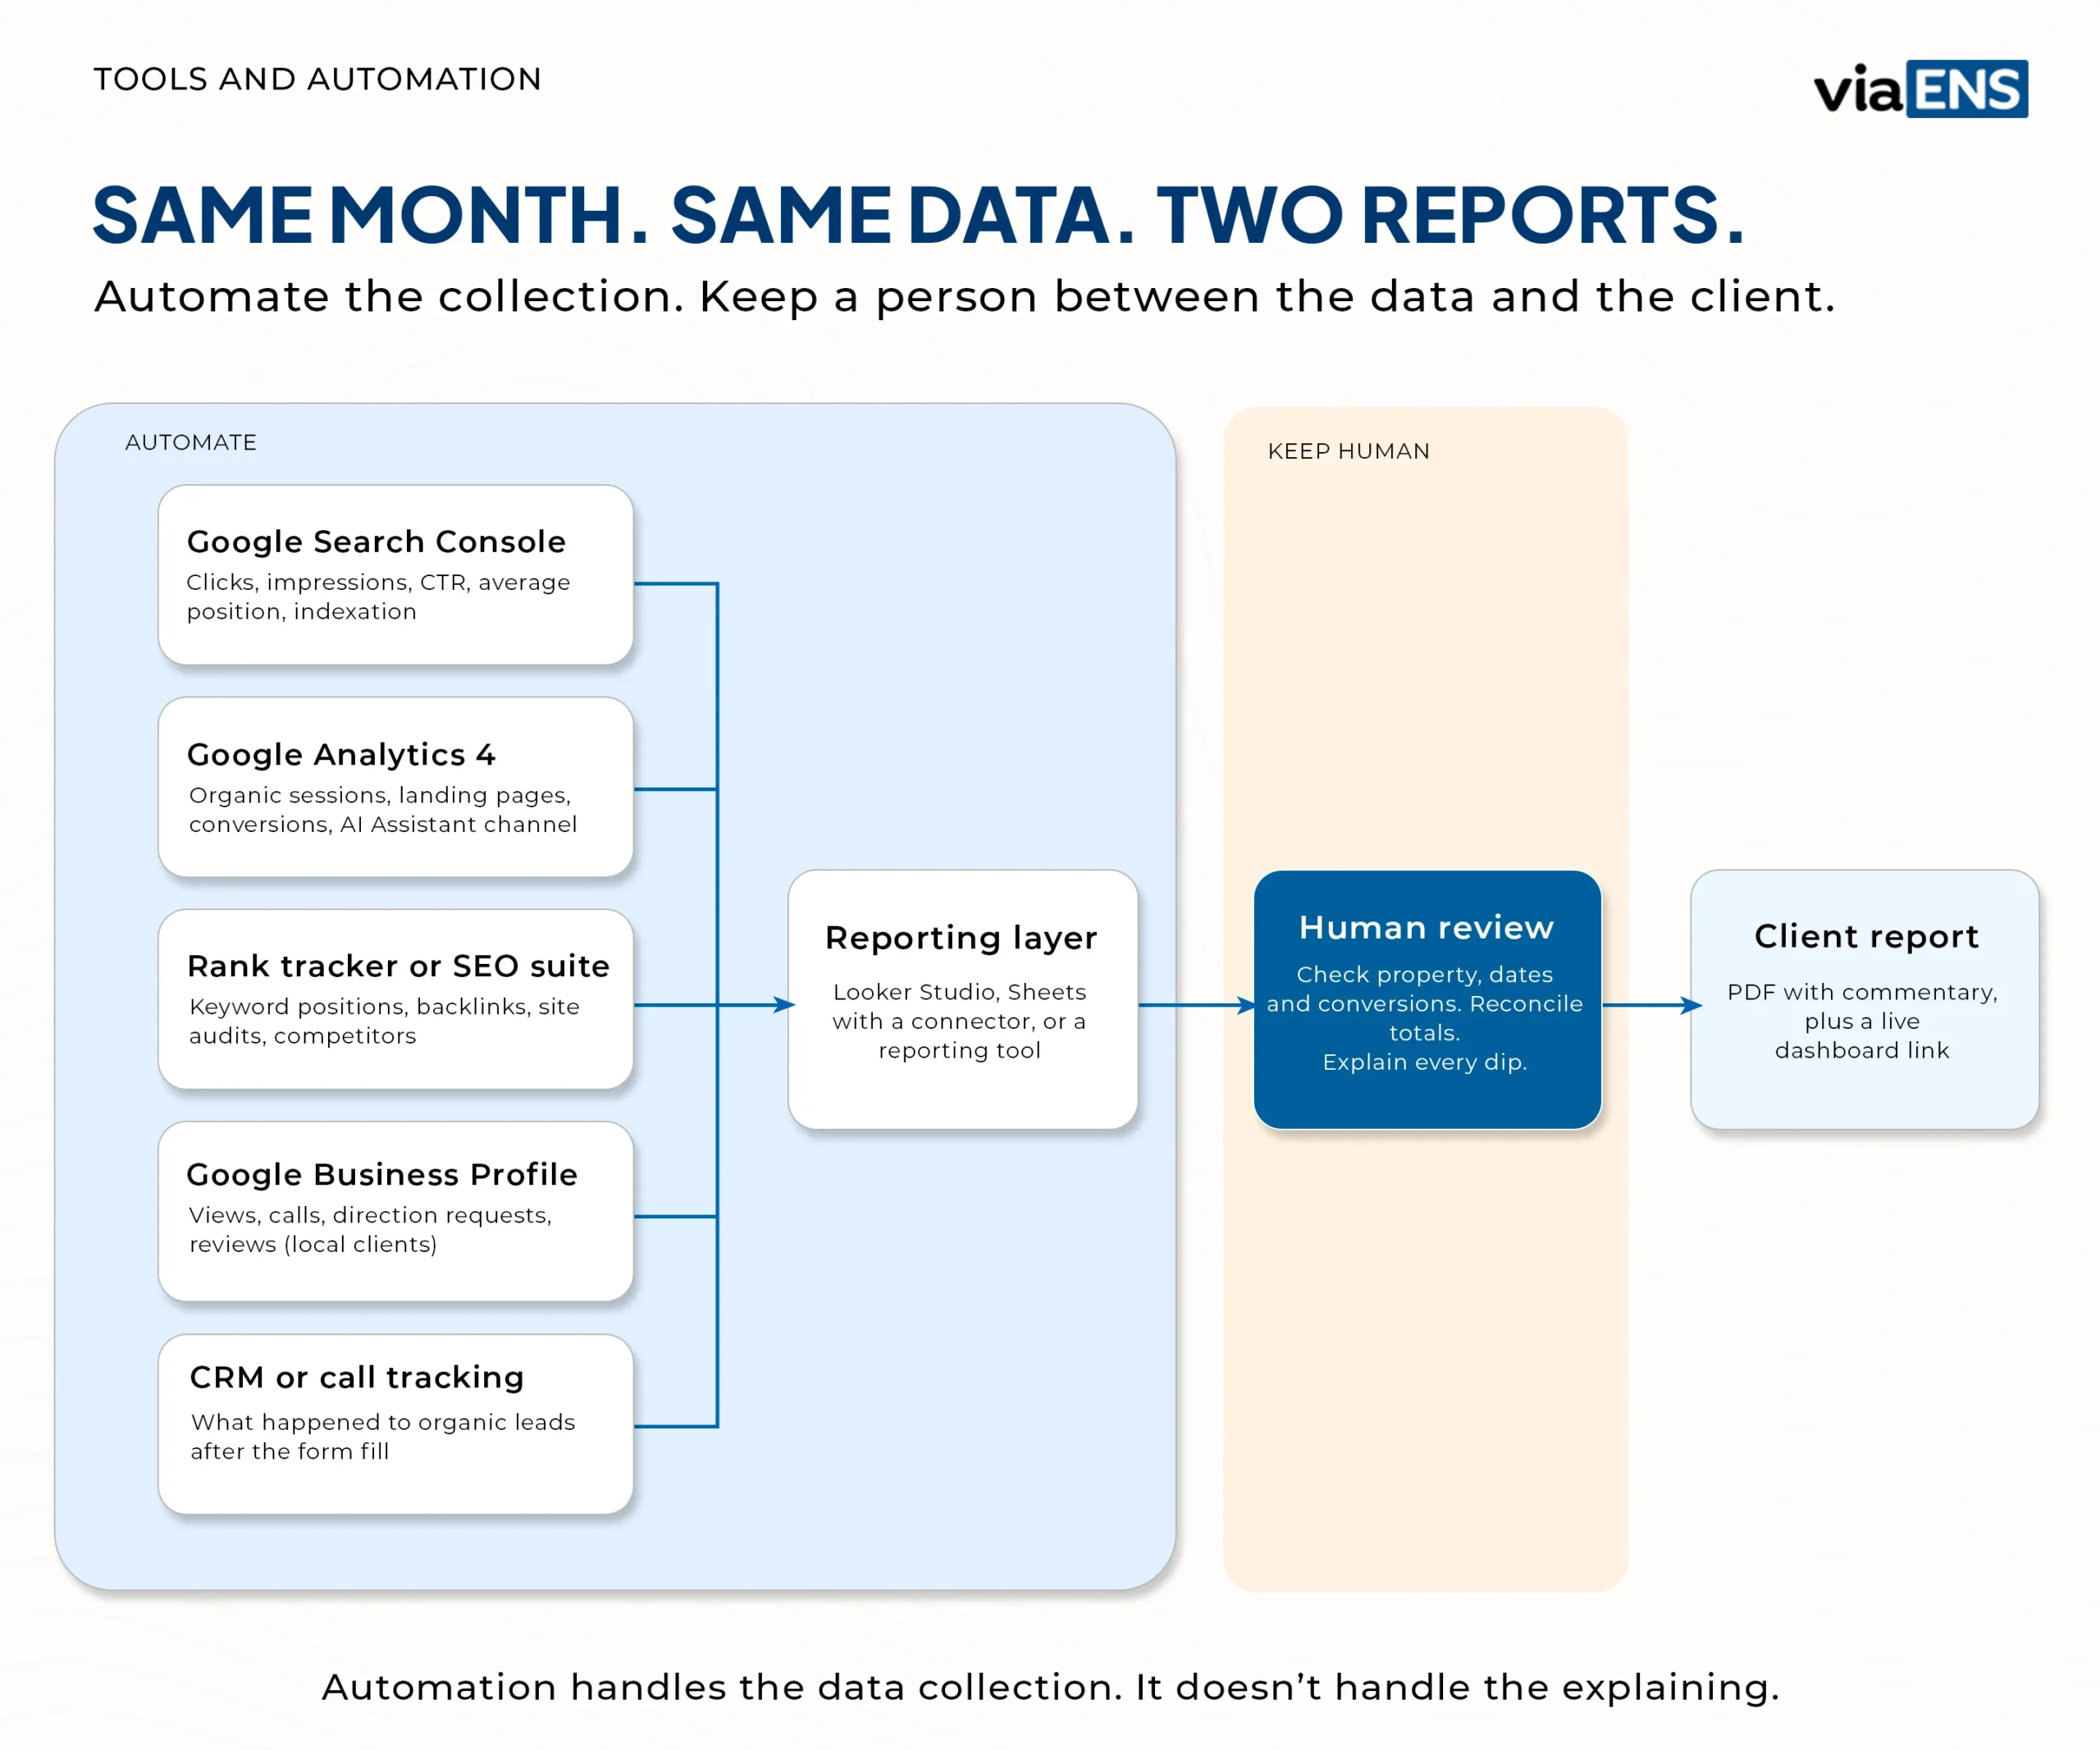
The catch with dashboards is that a client left alone with one usually misreads something. I like to send the PDF report as the main deliverable and share a live dashboard alongside it for anyone who wants to dig in. And whatever tool builds the report, I read it before it goes out. Automation handles the data collection. It doesn’t handle the explaining.
How you send the report matters almost as much as what’s in it. Send it on the same day each month with a short covering note that names the two or three things to look at first. Many people don’t read a full PDF, so a short email or a quick screen-recorded walkthrough of the highlights raises the odds that it is understood, and an occasional 15-minute call keeps the relationship personal.
If you would rather not send it by hand every month, most reporting tools can schedule delivery; just keep a human in the loop, for example by sending the scheduled report to yourself first and forwarding it with a note.
How to Automate SEO Reports: Tools and Workflow Behind Them
Automation should handle collection, not explanation. The goal is to stop copying numbers between tabs so the time goes into analysis. Most reports pull from the same few sources, which a reporting layer then combines:
- Google Search Console and GA4: clicks, impressions, average position, indexation and the branded and AI views; then organic sessions, landing pages, conversions and the AI Assistant channel.
- A rank tracker or SEO suite (such as Semrush or Ahrefs): tracked keyword positions, backlinks, site audits and competitor data.
- Google Business Profile and the client’s CRM or call tracking: local actions for local clients, and what happened to organic leads after the form fill, which is the closest most agencies get to real revenue.
The reporting layer is where tool choice matters. There is no single best option; it depends on your budget, how much customization you need and how many clients you report for:
| Tool | Best for | Trade-off |
|---|---|---|
| Google Looker Studio | Free, fully customizable dashboards on GA4 and Search Console | Setup and ongoing maintenance take time |
| Whatagraph | Visual, multi-source reports with white-label branding and scheduled delivery | Very granular customization can need workarounds |
| DashThis | Quick, template-based dashboards with many integrations | Deep customization is more limited |
| SE Ranking Report Builder | Scheduled white-label reports from rank tracking, audits, backlinks, GA4 and Search Console, plus guest links for clients | Works best if you already track projects in SE Ranking |
| TrueRanker | Scheduled PDF or live-link reports that include AI visibility | Built around its own rank-tracking data |
| Reporting Ninja | Ready-made SEO templates and automated delivery | Fewer advanced customization options |
Whichever you pick, keep the data layer (the connections), the interpretation layer (what you write) and the presentation layer (design and branding), all separate. When a connector breaks or a client’s goal changes, you fix one layer without rewriting the rest. The tool matters less than what you write inside it, since exports straight from all-in-one suites tend to be rigid, which is why many agencies reshape them in a reporting layer first.
Then build in the human steps automation can’t do. This includes checking the property, date range and conversion definitions, reconciling headline totals against the source reports, and explaining any dip before it lands in a client’s inbox. Treat AI-drafted summaries as a first draft, because they can quietly turn a correlation into a cause. Features and pricing change often, so check current plans before committing.
Common Mistakes in Client SEO Reporting
The most common mistake I see is reporting to impress the client instead of to inform them. Pages of green arrows feel great until the month one of them turns red and nobody’s been prepared for it.
Another is sending the same report to every client. A local service business and an ecommerce store care about completely different numbers, and the report should reflect that.
Then there’s reporting without ever asking the client what they want to see. I make a habit of discussing the format in the next catch-up after the first report goes out. Some clients want more data, some want less. Either way, you learn something.
And the quiet one, dropping the report the moment results dip. That’s exactly when the client most needs the explanation. If you’re the one hiring, a good test is to see whether the agency keeps reporting honestly through the bad months or not. If yes, it is the one worth keeping. Here’s a quick reference for the rest:
| Mistake | Why it hurts | Fix |
|---|---|---|
| Too many KPIs | Clients lose focus and the important numbers get buried | Limit the report to goal-driven metrics |
| Numbers with no context | Data feels random or misleading | Add a short explanation for every major shift |
| A dashboard with no narrative | Clients still need interpretation, limits and priorities | Pair every dashboard with a written summary |
| Claiming causes too quickly | Timing suggests a cause but rarely proves it | Label inferences and run more checks before asserting a cause |
| Ignoring implementation status | Recommendations can’t affect results until approved and live | Track what has shipped and what is waiting on the client |
| Late or inconsistent delivery | Clients can’t compare month to month and confidence drops | Send on the same day, in the same structure |
A Quick Q/A Checklist
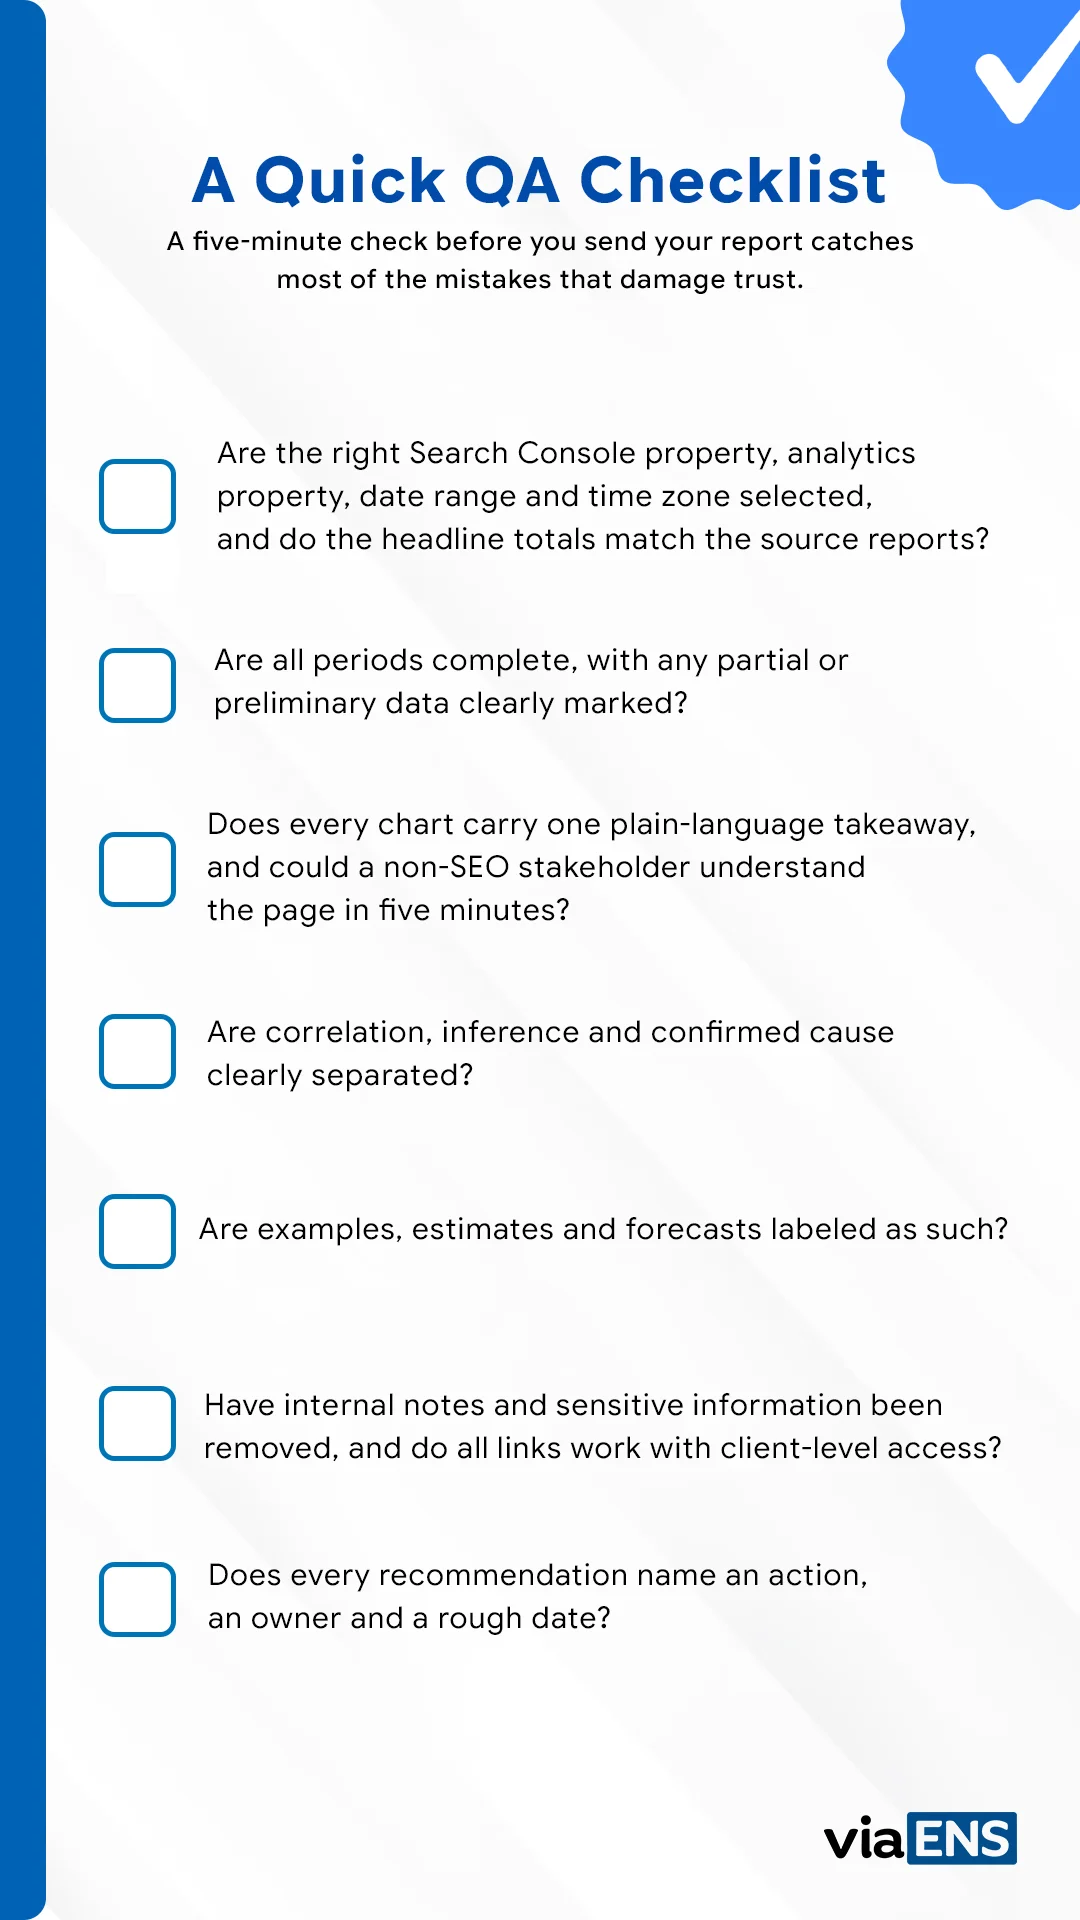
A five-minute check before you send your report catches most of the mistakes that damage trust. It is also a useful list for anyone on the receiving end of a report who wants to know what to look for. Look for the following:
- Are the right Search Console property, analytics property, date range and time zone selected, and do the headline totals match the source reports?
- Are all periods complete, with any partial or preliminary data clearly marked?
- Does every chart carry one plain-language takeaway, and could a non-SEO stakeholder understand the page in five minutes?
- Are correlation, inference and confirmed cause clearly separated?
- Are examples, estimates and forecasts labeled as such?
- Have internal notes and sensitive information been removed, and do all links work with client-level access?
- Does every recommendation name an action, an owner and a rough date?
Final Thoughts
A good SEO report isn’t about making the numbers look better than they are. It’s about making sure the client can see the work, understand the results, and trust where things are heading. Get that right and even the slow months stop being a problem. The next time you sit down to build one, ask yourself what question the client is quietly hoping it answers, and start there.
FAQs
How often should an SEO report be sent to clients?
Monthly works for most clients, with a quarterly review layered on top. Larger accounts sometimes want a mid-month check-in as well. Weekly updates make sense during migrations, launches or incidents, and stakeholders such as investors or a board usually want a quarterly or annual view.
What should an SEO report show when there are no positive results yet?
Report the leading indicators, impressions, indexation, and average position, plus the work completed and the timeline you set upfront. If the numbers are flat, say so and explain what you’re doing about it.
Should clients get raw data or a summarized view?
A summarized view, with the raw data available on request. Most clients want conclusions, not spreadsheets, and a live dashboard can cover anyone who wants to dig deeper.
What’s the single biggest reason clients get frustrated with SEO reports?
Lack of context. A page full of metrics with no explanation of why the numbers moved leaves the client to guess, and they’ll usually guess the worst.
How to build an SEO performance report for investors?
Use fewer, higher-level numbers: organic share of leads or revenue, year-over-year growth, and how the return compares with the spend. Report quarterly or annually, state your assumptions, and separate confirmed results from projections.
How to generate SEO reports for enterprise clients?
Layer the report, with a one-page executive view on top and detailed sections for each team (content, development, product, regional markets) underneath. Automate data collection from Search Console, GA4 and your rank tracker, segment by market or template, and keep a human review step before anything is sent.
What is the best weekly and monthly SEO report format for clients?
A weekly report works best as a one-page snapshot or live dashboard with a few KPIs and notes on any launch or incident. A monthly report should be the fuller version: executive summary, KPIs with commentary, work completed and next steps, usually as a PDF with a dashboard link alongside.
6 thoughts on “What to Include in SEO Reports for Clients (and What to Skip)”
Comments are closed.